Cloud Dashboard · Revenue & Margin
See your expected revenue and margin without Excel
Built for staffing and secondment agencies. The forecast calculates itself from your placements and stays up to date on its own.
Fortemporary staffing and secondment
Datafrom your ATS and back office
2 weeksuntil your own figures are ready
What it looks like
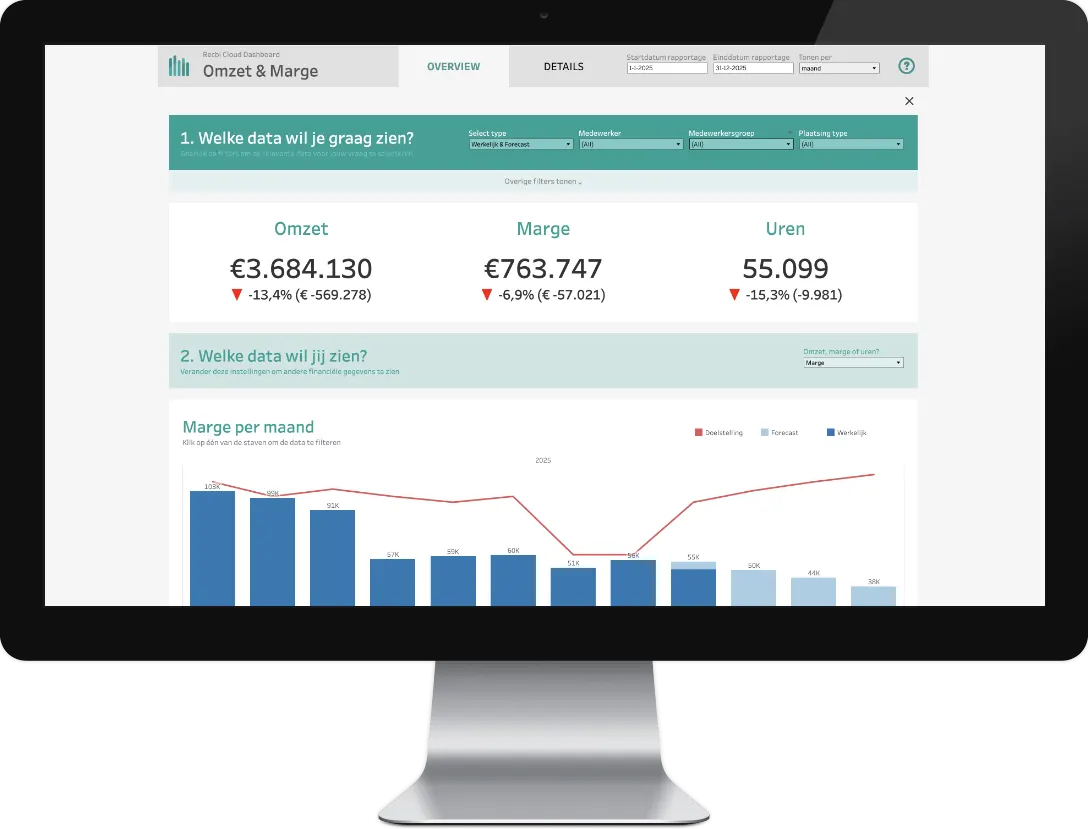
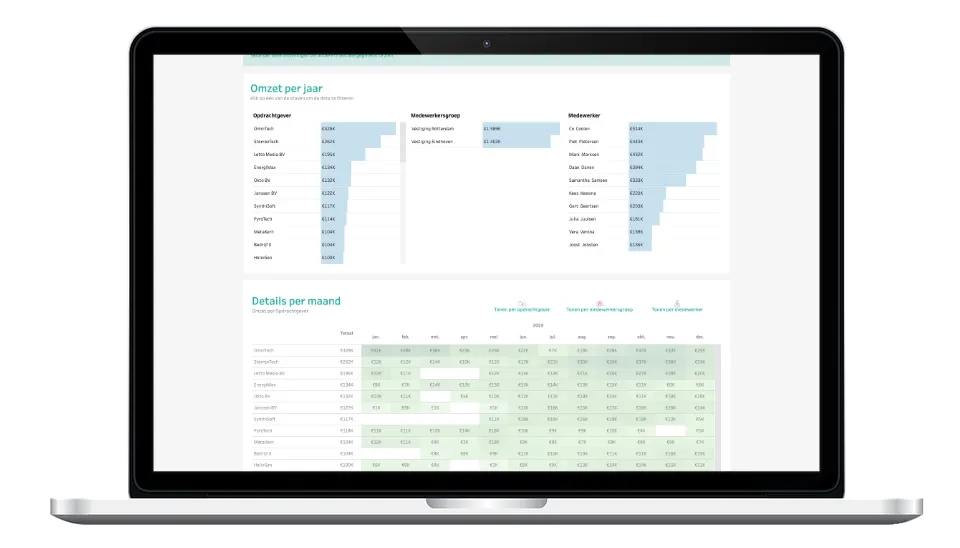
The Revenue & Margin dashboard
Screenshots of the standard dashboard, with test data.
What it answers
The questions this dashboard answers
Are we on track for our targets this quarter?
How much revenue and margin is already secured for the rest of the year?
Are people working the hours we placed them for?
What you see
What you see in this dashboard
- Forecast from your placements Expected revenue, margin and hours, with public holidays, leave and sickness absence taken into account. Also for placements that run on hours worked instead of an end date.
- Forecast and actuals side by side Without a timesheet, the forecast counts. Once the timesheet is approved, the hours worked count.
- Against last year and your targets By branch, department or colleague. By month, 4-week period or week.
- Contract hours and hour types Is someone working the agreed hours? How often is someone off sick? You see it per placement.
In short
KPIs, systems and who it's for
KPIs in this dashboard
- Expected revenue, margin and hours
- Forecast next to hours worked
- Comparison with last year and your targets
- Contract hours next to hours worked
- Sickness absence per placement
Who it's for
See the Revenue & Margin dashboard with your own figures
In a demo we show it using the questions you have right now. We'll also tell you which of your systems we connect.