Cloud Dashboard · Recruitment
Know how many placements are in your funnel
All your open matches on one screen: which stage they're in, how long they stay there and what comes out of them.
Forsecondment, perm recruitment and in-house
Datafrom your ATS and back office
2 weeksuntil your own figures are ready
What it looks like
The Recruitment dashboard
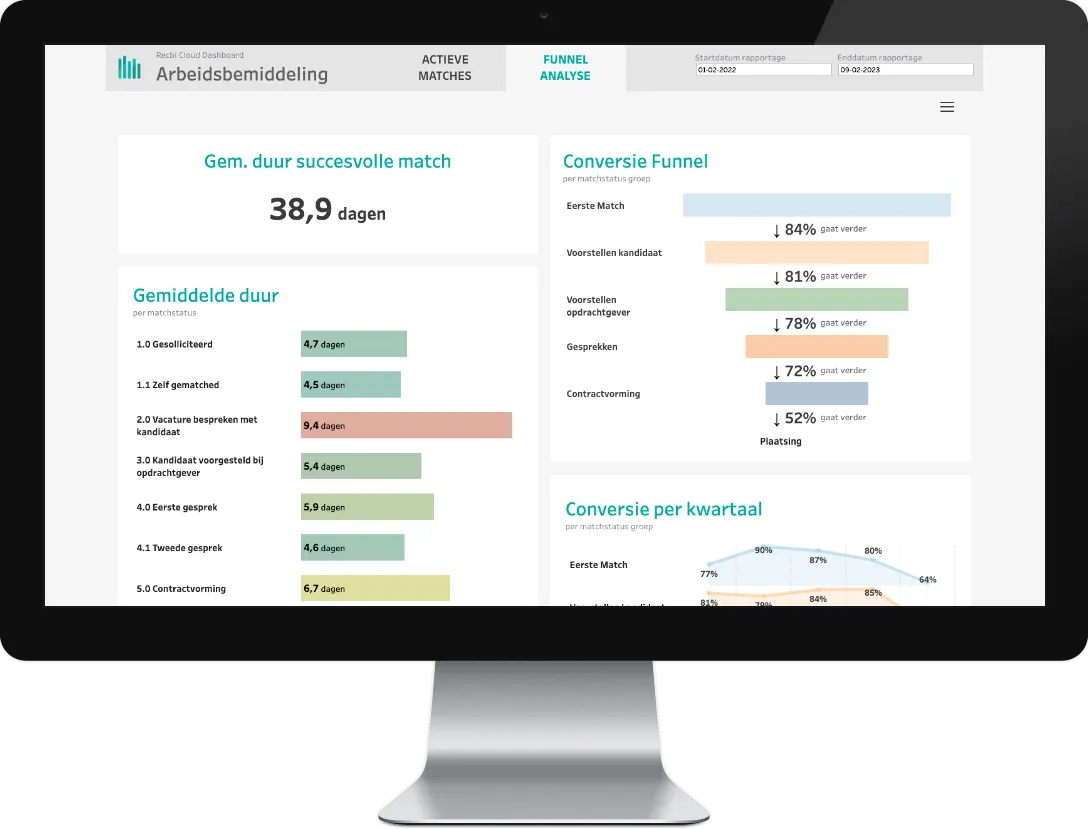
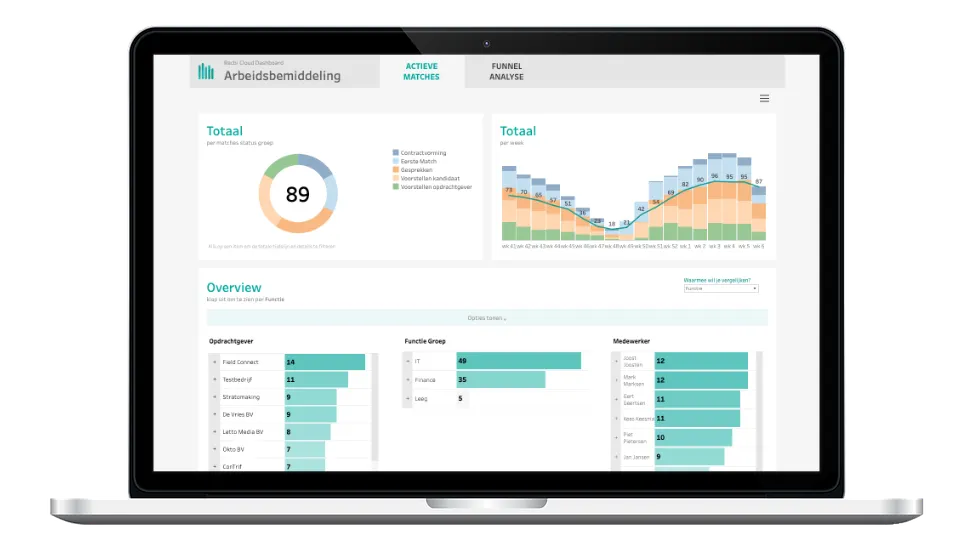
Screenshots of the standard dashboard, with test data.
What it answers
The questions this dashboard answers
How many placements can I expect from my current funnel?
At which match stage do most candidates drop out?
Do we have enough active processes, or do we need to push for more?
What you see
What you see in this dashboard
- Placement forecast Based on past results, you see how many placements to expect from your current funnel.
- Lead time per match stage See how long candidates stay in each stage and where the process gets stuck.
- Conversion rate per stage Where do most candidates drop out? Compare teams and colleagues, and follow the trend per quarter.
- Current matches Which active processes are running now, for which client and with whom? You can also filter on secondment-to-perm, interim or perm recruitment.
In short
KPIs, systems and who it's for
KPIs in this dashboard
- Average time per match stage
- Conversion rate per match stage
- Expected placements from your funnel
- Current matches per stage
- Matches per team, client or job title
See the Recruitment dashboard with your own figures
In a demo we show it using the questions you have right now. We'll also tell you which of your systems we connect.